iCov

iCov (infobox voor Crimineel en Onverklaarbaar Vermogen) has a partnership with various government organizations to trace unlawful obtained assets so they can be confiscated and returned. However, with the tools they currently have, it can be quite hard to find suspicious relations.
So in commission for iCov, we wanted to make sure that partners can analyze the relationship scan with as little time and effort as possible. This means we have to look at how to make the current solution better or think of something new. The new solution must be user-friendly and interactive.
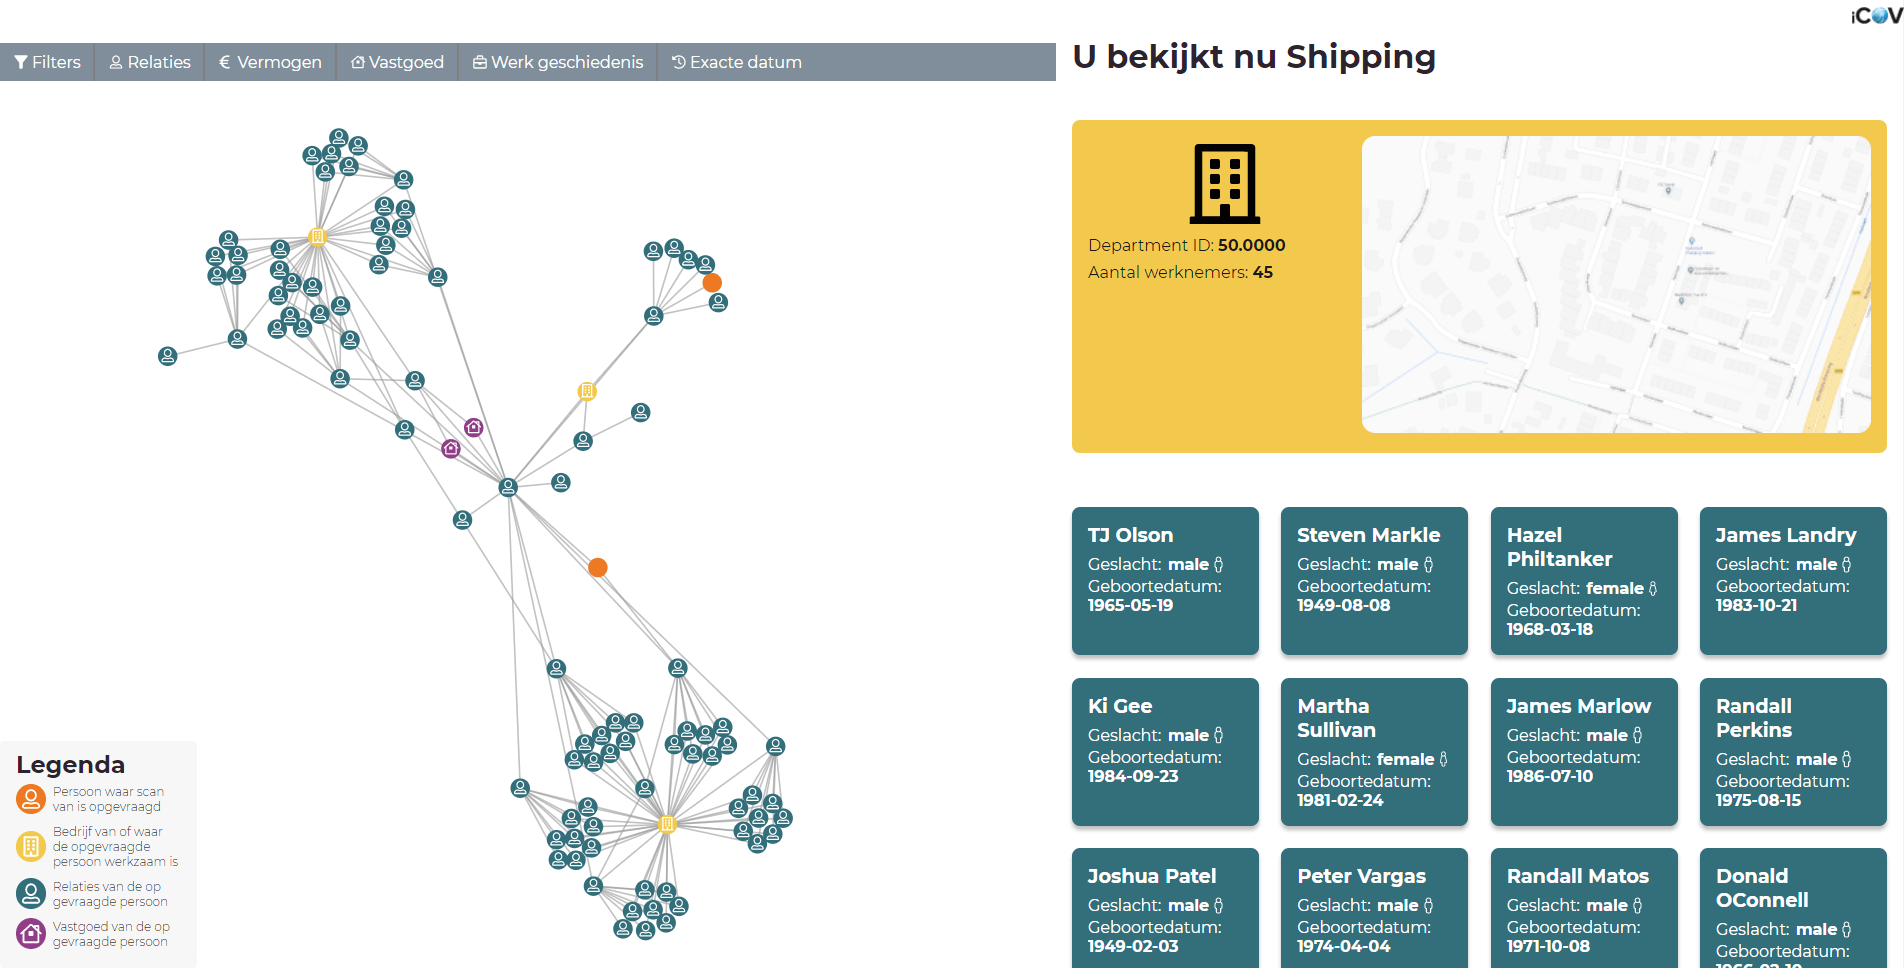
We ended up creating an interactive network graph showing all connected data. To assist this visualization we also created an insight panel on the side of the page to show more detailed information on the selected nodes in the graph.
Tech stack used
- svelte
- nodejs
- surge
This project was build using Svelte, d3.js and Node.js. D3 was used to visualize the dataset provided through a custom API made with Node.js. Svelte used to build the front end of this site. I used Svelte since I find it easy to use and is fast.
My main role during this project was to create a working version of the app. Apart from the technical parts of the project I also helped to create concepts and designing the data visualization.
Check out the GitHub wiki for more detailed information and the design process of the project.